- myFICO® Forums
- FICO Scoring and Other Credit Topics
- General Credit Topics
- Credit Karma vs FICO
- Subscribe to RSS Feed
- Mark Topic as New
- Mark Topic as Read
- Float this Topic for Current User
- Bookmark
- Subscribe
- Mute
- Printer Friendly Page
Credit Karma vs FICO
Is your credit card giving you the perks you want?
Browse credit cards from a variety of issuers to see if there's a better card for you.
- « Previous
- Next »
- Mark as New
- Bookmark
- Subscribe
- Mute
- Subscribe to RSS Feed
- Permalink
- Report Inappropriate Content
Re: Credit Karma vs FICO
@Anonymous wrote:
@iv wrote:(Unlike VS2, which was ridiculously easy to pin at 990....)
What source is there for a VS2 score? I've never seen one personally, but would be interested to see it for S&G's if it's possible.
Until early 2015, Credit Karma supplied both TU VS2 and TU NAS, then they added EQ and started offering just VS3 for both EQ and TU.
At this point, VS2 seems to have basically disappeared... but it was the easiest score model to max out that I've ever seen.
EQ9:847 TU9:847 EX9:839
EQ5:797 TU4:807 EX2:813 - 2021-06-06
- Mark as New
- Bookmark
- Subscribe
- Mute
- Subscribe to RSS Feed
- Permalink
- Report Inappropriate Content
Re: Credit Karma vs FICO
@Anonymous wrote:
@Anonymous wrote:I wonder whether BBS or iv might get a few extra points on V3 if their total utilization went from < 1% to something like 4.2%. I believe TT has conjectured that V3 has a sweet spot around there -- and that ultralow utilizations by comparison (e.g. 0.7%) have a small scoring penalty.
While my reported utilization usually sits at 1% aggregate, I have taken it as high as 5% at least once in the last 8 months and it's come in at 3% and 4% a couple of times as well just the way balances fell when I wasn't micromanaging them. I never saw any clear score shifts on my VS 3.0's (that I couldn't tell were from something else) so I'm not sure that those utilization changes mattered on my profile.
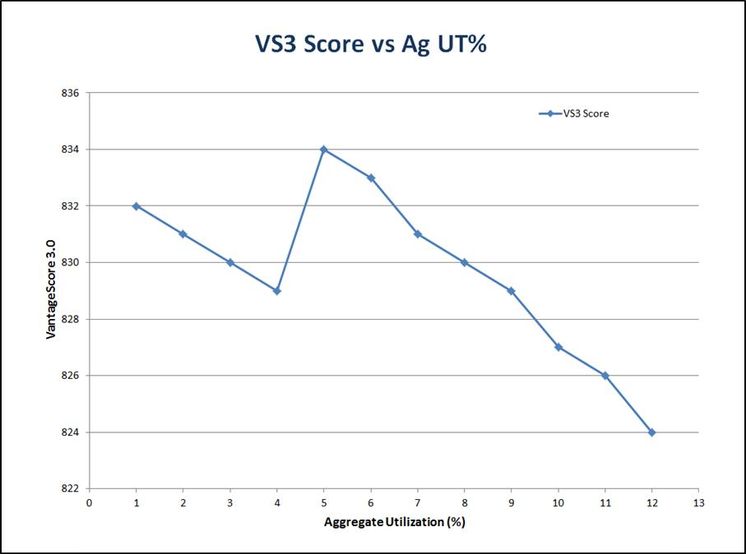
Given that the spike manifest on three separate occassions (each a year apart) somewhere in the 4.0% to 6.0% utilization range, I suspect other clean profiles would show a spike as well. The observed peak score was 2 points higher than achievable in the 0% to 1% UT plateau. The spike is difficult to encounter real time with actual data. What started me on this investigation was an actual 5 point VS3 score spike on all three CRAs going from a reported 3% AG UT to a reported 4% AG UT. The EQ and TU VS3 score jumps happened even though more cards had balances and highest individual card UT increased. I saw the same result on EX VS3 score from credit.com.
Even more enlightening was the drop in Experian NE score to 829 from 840 (2/8/2016). Experian NE had always remained at 840 up to this point in time. The credit scoring models were considering the change in # accounts reporting and change in AG UT% but, EX VS3 and EX NE scores were moving in opposite directions.
I pulled a 3B report from MyFico (2/14/2016) and saw a dramatic drop in EQ mortgage score (809 => 764) due to all cards reporting balances (6 of 6) along with notable drops in TU mortgage (823 => 812) and EX mortgage (837 => 832). I pulled another report in March after reducing # cards reporting to 3 from 6 (AG UT down to 2% from 4% - this is inconsequential) and scores rebounded. Conclusion: Various other credit scoring models were seeing and reacting negatively to increase in # accounts with balances and/or increased AG UT% but, VS3 does not look at # accounts with balances and VS3 liked a UT in the 4% to 5% range better than a UT in the 3% range. [side note: All Classic Fico 8 scores remained at 850 - benefit of buffer?]
Note: CK summarized UT to the nearest whole number so the real data point lacks precision. I think CK truncates which, if correct, means the reported 4% was somewhere between 4% and 5%.
I'd be interested in seeing results for your file - if you are willing to conduct a high resolution simulation. The spike is abrupt so incremental increases in AG UT% should be limited to 0.2% when testing utilization in the 4% to 6% range. It appears the peak can move depending on profile specifics as it manifest around 4.5% to 4.7% one time and then around 5.5 - 5.7% another time a year later.
So far, no takers on using CKs simulator to generate detailed simulation data on VS3 score vs aggregate UT%. Generating the data points would take 10 minutes. Keying in results and generating a graph (like the below) probably another 10 to 20 minutes. Again, pinpointing the peak requires testing small incremental changes and the actual maximum was not static.
Initial (2016) simulation/graph
Recent (late 2018) simulation/graph
Fico 8: .......EQ 850 TU 850 EX 850
Fico 4 .....:. EQ 809 TU 823 EX 830 EX Fico 98: 842
Fico 8 BC:. EQ 892 TU 900 EX 900
Fico 8 AU:. EQ 887 TU 897 EX 899
Fico 4 BC:. EQ 826 TU 858, EX Fico 98 BC: 870
Fico 4 AU:. EQ 831 TU 872, EX Fico 98 AU: 861
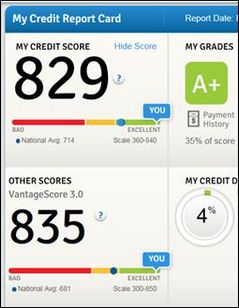
VS 3.0:...... EQ 835 TU 835 EX 835
CBIS: ........EQ LN Auto 940 EQ LN Home 870 TU Auto 902 TU Home 950


